Project
Liver Fat Fraction Assessment by Ultra-Low Dose CT
MRI-supervised 3D liver fat fraction mapping — quantifying fatty liver at the radiation dose of a two-view chest X-ray, making CT-based NAFLD screening of asymptomatic populations plausible for the first time.
Why fatty liver needs a screening test
Non-alcoholic fatty liver disease (NAFLD) — the accumulation of fat within liver cells — is the most prevalent chronic liver disease worldwide, affecting roughly 25% of the global population. About 5% of cases progress to non-alcoholic steatohepatitis (NASH), which raises the risk of fibrosis, cirrhosis and hepatocellular carcinoma, and is the second leading cause of liver transplantation in the United States.
Critically, NAFLD is reversible when caught early: diagnosis and care at an early stage can halt or reverse disease progression through lifestyle intervention or medical treatment. That makes NAFLD an unusually strong candidate for population screening — yet no screening test for it exists in practice today.
The gap in current diagnosis
Every existing method for liver fat quantification trades away something a screening test cannot afford to lose:
| Method | Sensitivity at low fat % | 3D map | Radiation | Accessibility |
|---|---|---|---|---|
| Ultrasound | Poor, operator dependent | ✗ | None | ✓ |
| CT | Low | ✓ | High | ✓ |
| MRI | Very high | ✓ | None | ✗ |
| Biopsy | Gold standard | ✗ | None | ✗ |
Biopsy is the gold standard but is invasive and samples a tiny volume of the liver. MRI-derived fat fraction mapping is non-invasive and highly accurate, but costly and inaccessible at population scale. Ultrasound is cheap and available everywhere, but operator-dependent and unreliable precisely where screening matters most — at low fat fractions. CT is accessible and produces true 3D maps, but at normal dose its radiation burden rules it out for asymptomatic people.
Our goal: close the gap with ultra-low dose CT
CT already has three of the four properties. The problem is dose. So we attack dose directly: acquire the liver at an ultra-low dose, and recover MRI-grade fat fraction accuracy computationally — by training the model against MRI-derived fat fraction maps.
The clinical method today relates unenhanced CT Hounsfield Units to fat fraction with a linear fit calibrated for 120 kVp scans. That relationship holds reasonably at normal dose and 120 kVp, but it degrades at other tube voltages, and at ultra-low doses the noise is so severe that linearity effectively breaks down. Recovering fat fraction from such data requires more than a line.
A unique prospective dataset
35 subjects were prospectively recruited at Sheba Medical Center and gave informed consent. Each received, on the same day: a pair of ultra-low dose CT scans at 80 kVp and 140 kVp on a single-energy Revolution CT scanner (GE Healthcare), and in-phase / opposed-phase gradient-echo MRI on a 3T Ingenia scanner (Philips). Tube current was fixed by BMI — 10/20 mA (140 kVp) and 20/40 mA (80 kVp) for BMI ≤ 29 and BMI > 29 respectively.
The MRI in-phase (IP) and opposed-phase (OP) images yield the ground-truth fat fraction map through FF = (IP − OP) / (2 · IP). Across the cohort, MRI-derived liver fat fraction spans 0.7% to 34.3% (median 4.5%), covering healthy livers through severe steatosis.

Before training, the liver is segmented in CT with a SwinUNETR model and in MRI with an Attention U-Net, and the MRI and 80 kVp scans are registered to the 140 kVp scan using SuperElastix in a two-step rigid then non-rigid process.
Method: joint denoising and fat fraction mapping
The framework has two neural blocks — a denoiser and a fat fraction regressor — trained with two different supervision signals, and then fine-tuned together end-to-end. Both supervision signals are used only at training time. At inference the network sees nothing but the single-energy 80 kVp scan.
Ultra-low dose CT denoising
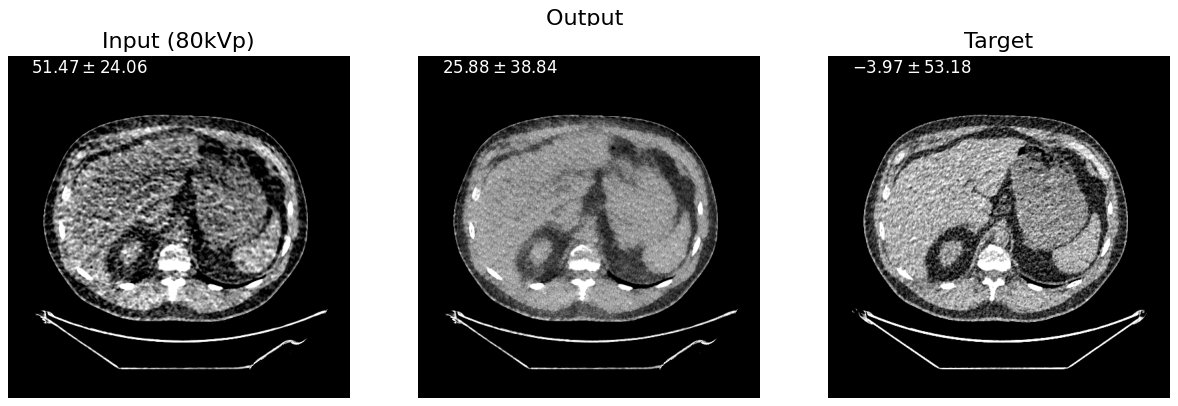
The 80 kVp scans are extremely noisy — too noisy, in their raw form, for accurate fat fraction estimation. We denoise them using the 140 kVp scan of the same subject as the training target. Although the 140 kVp scan is itself an ultra-low dose acquisition at the same fixed tube current, the higher tube voltage produces a markedly less noisy image, which makes it a usable supervision signal without ever exposing the patient to a normal-dose scan.
The denoiser is a convolution-only 2D DnCNN trained on random 64 × 64 patches with a VGG16 perceptual loss. Perceptual loss was chosen over pixel-wise L1 or MSE deliberately: we want the network to learn high-level structural and textural features rather than to reproduce the exact HU values of the 140 kVp scan, so that it enhances the 80 kVp input while preserving clinically relevant content.
Fat fraction regression
Regression is performed by a SwinUNETR operating on random 3D patches of 32 × 128 × 128, initialised from pre-trained Swin transformer weights. Both the original 80 kVp volume and its denoised version are fed to the network, giving it more to work with than a single-energy input alone. Training uses a masked, voxel-wise L1 loss computed only over liver voxels.
Joint fine-tuning
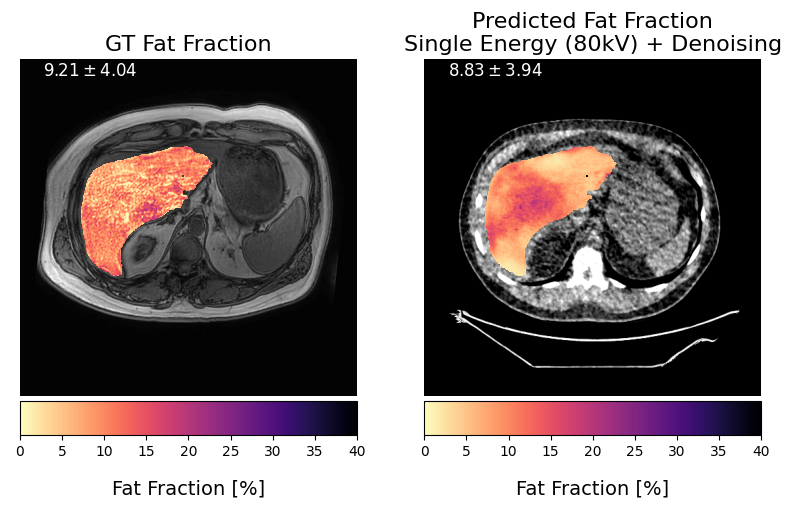
After each network is trained individually, the two are fine-tuned jointly from their respective pre-trained weights, optimising only the masked L1 distance on the final fat fraction prediction. No regularisation is applied to the denoised intermediate output — the denoiser is free to adapt its parameters away from "looking like a 140 kVp scan" and toward whatever representation best serves the fat fraction estimate.
Experiments
The 35 cases were split into an external test set of 10 and a cross-validation pool of 25, stratified by fat fraction so both reflect the same distribution. The 25 were used for five-fold cross-validation — each fold of 5 serving as validation once, with the other 20 for training.
Five models were compared, at two energies:
- LR-80 / LR-140 — linear regression from CT Hounsfield Units to fat fraction, fitted at each energy. This is the current clinical approach.
- NN-80 / NN-140 — the neural fat fraction regressor alone, on raw input.
- NN+DN-80 — the proposed model: denoiser and regressor jointly fine-tuned, on 80 kVp input only.
Fitting the linear baselines across folds gives FF [%] = −0.26 · HU + 14.53 at 80 kVp and FF [%] = −0.58 · HU + 34.58 at 140 kVp. All experiments ran on a single NVIDIA RTX A6000 (48 GB) in PyTorch and MONAI.
Results
Every neural model substantially outperforms its linear-regression baseline. Both linear baselines produce a negative R² on the external test set — meaning they predict fat fraction worse than simply guessing the cohort mean.
| Model | Cross-validation L1 ↓ | Cross-validation R² ↑ | Test L1 ↓ | Test R² ↑ |
|---|---|---|---|---|
| 80 kVp only | ||||
| LR-80 | 4.75 ± 0.84 | −0.37 ± 0.87 | 6.45 ± 0.29 | −0.39 ± 0.16 |
| NN-80 | 3.20 ± 1.42 | 0.59 ± 0.21 | 3.96 ± 0.46 | 0.62 ± 0.09 |
| NN+DN-80 (proposed) | 2.43 ± 1.08 | 0.79 ± 0.12 | 3.96 ± 0.32 | 0.71 ± 0.03 |
| 140 kVp only | ||||
| LR-140 | 2.88 ± 0.29 | 0.36 ± 0.30 | 7.27 ± 0.35 | −2.97 ± 0.57 |
| NN-140 | 2.48 ± 1.18 | 0.73 ± 0.18 | 2.20 ± 0.40 | 0.86 ± 0.06 |
Mean ± SD L1 error and coefficient of determination (R²), averaged across the five cross-validation folds (N=25) and across the five models' predictions on the independent test set (N=10). Best value per column in green.
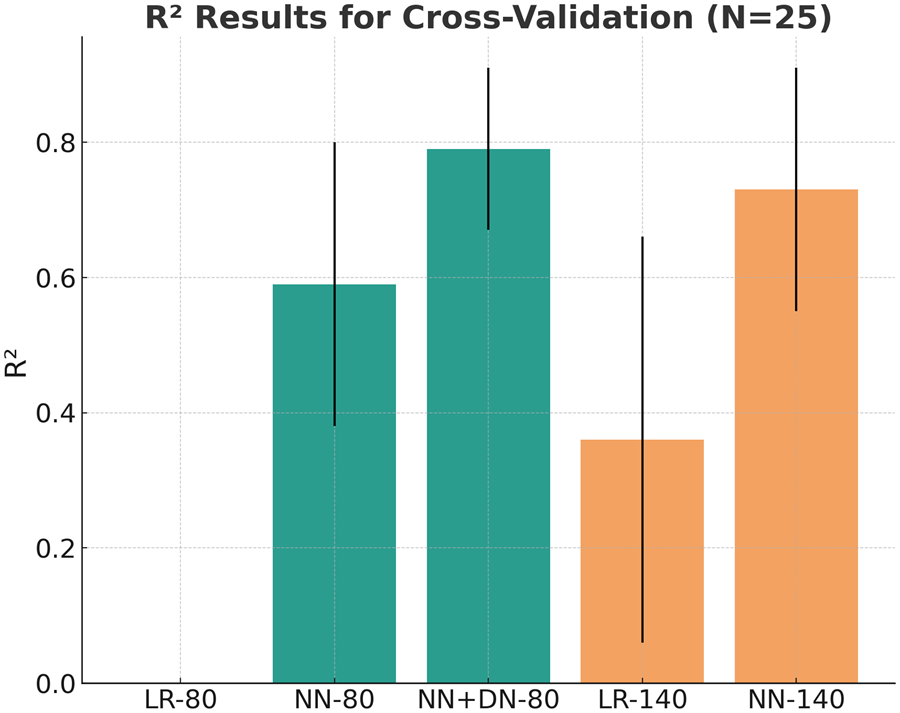
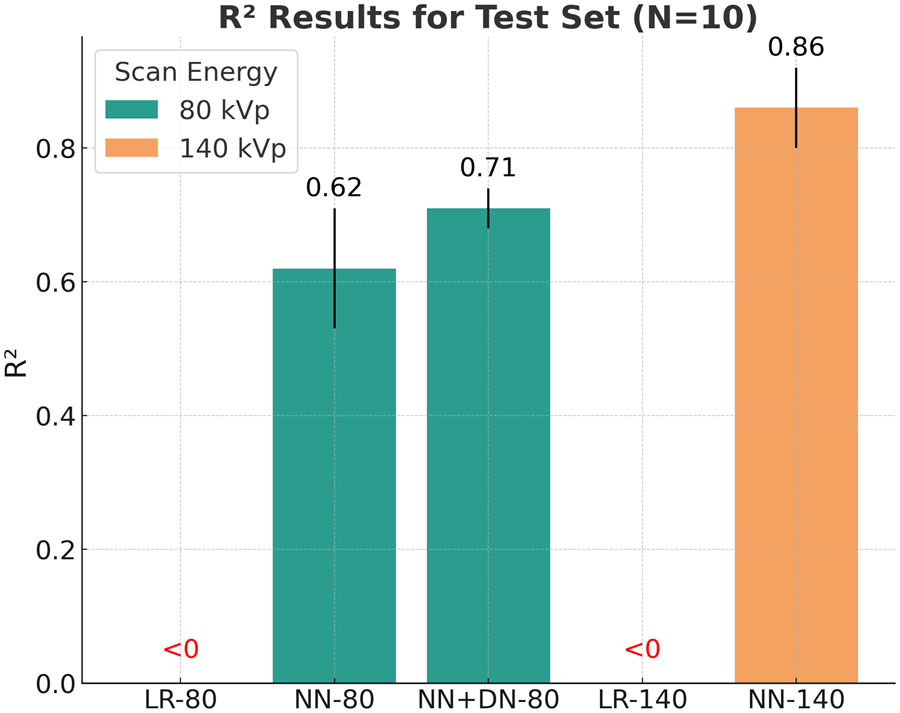
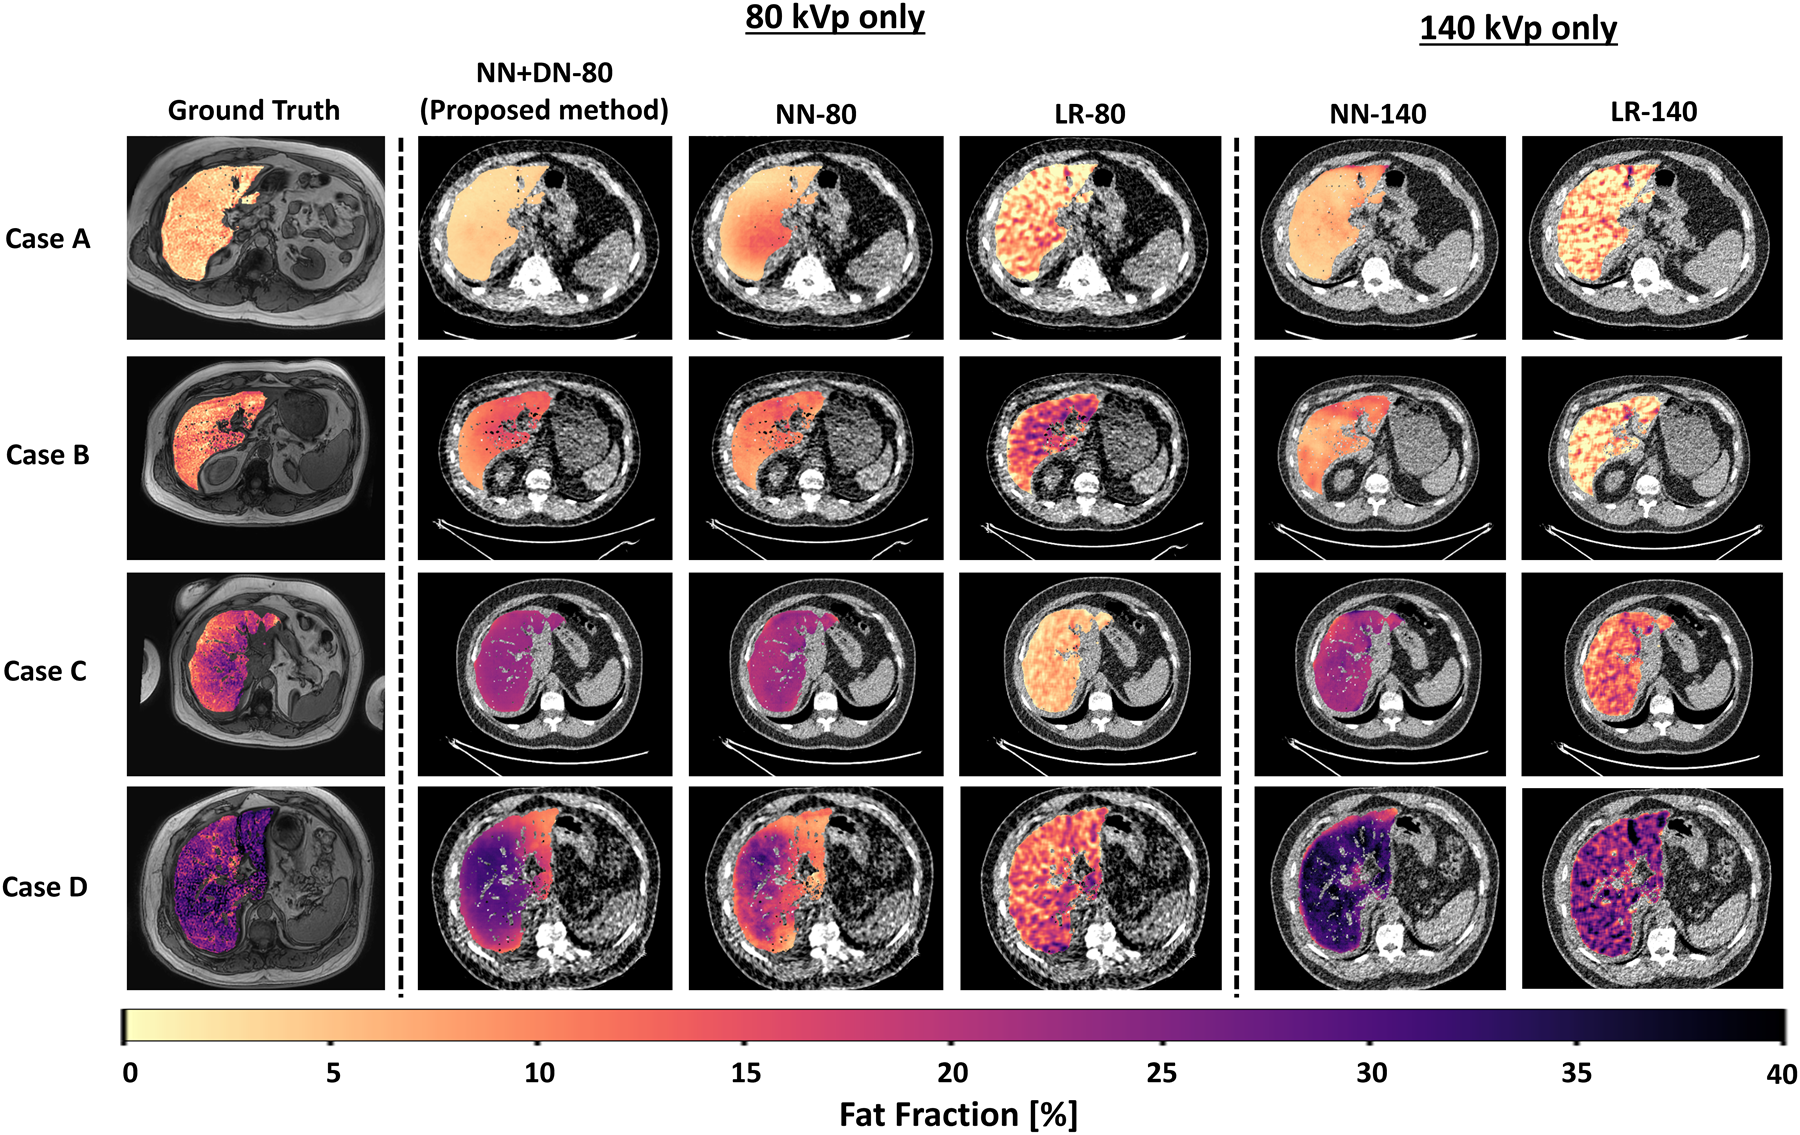
The denoiser is what makes ultra-low dose work. Adding it to the 80 kVp pipeline lifts R² from 0.59 to 0.79 in cross-validation and from 0.62 to 0.71 on the test set — a consistent improvement in both validation and testing. Qualitatively (see the figure at the top of this page), NN+DN-80 substantially improves spatial consistency and reduces artifacts relative to NN-80, producing maps that closely match the ground truth and performing comparably to the 140 kVp model while relying on 80 kVp input alone.
The 140 kVp model (NN-140) remains the strongest on the external test set at R² = 0.86, which is expected — it is given a less noisy scan at roughly double the dose. The proposed model's slightly lower test performance may reflect differences in data distribution between the training/validation and test sets, along with the small size of the external cohort.
Discussion & outlook
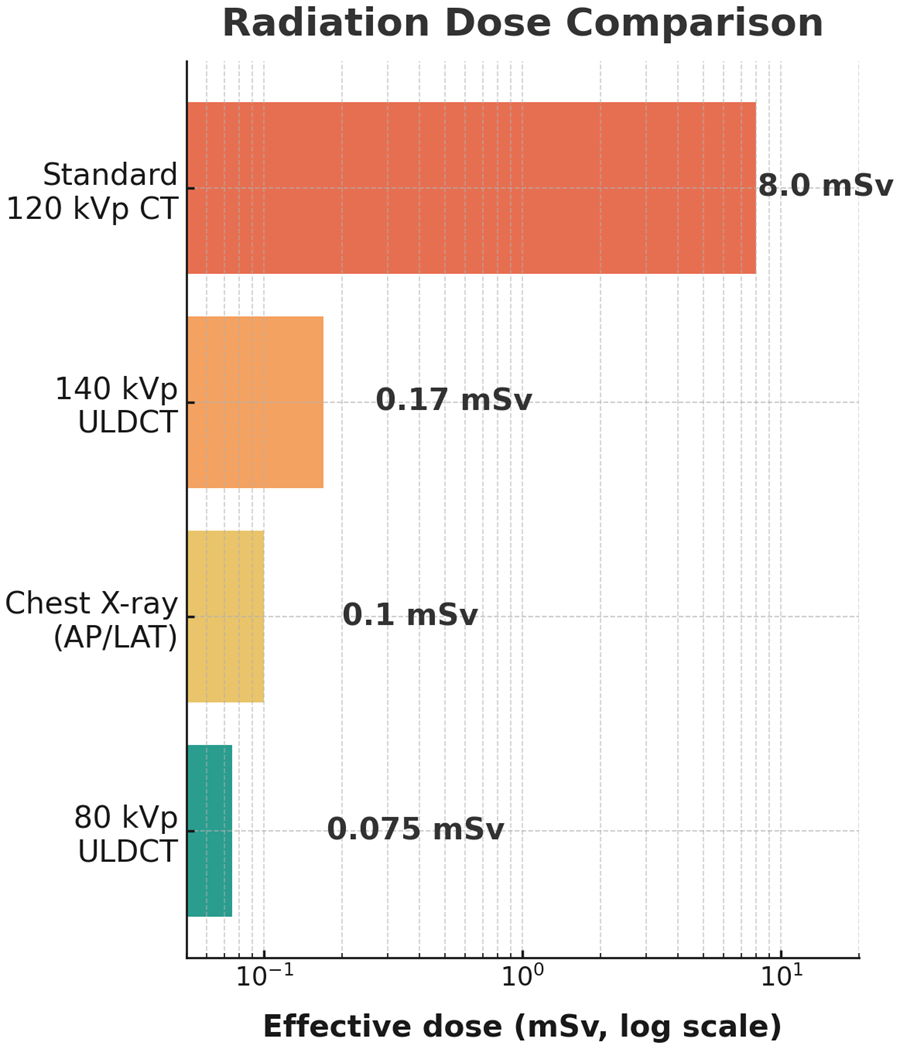
We presented a novel neural framework for non-invasive liver fat fraction quantification from ultra-low dose CT. Neural fat fraction regression consistently outperforms the standard linear fitting that is the current clinical method, and adding a neural denoiser improves accuracy further — enabling reliable prediction at an effective dose of merely 0.075–0.15 mSv, equivalent to an AP/LAT chest X-ray. To the best of our knowledge, this is the first demonstration of CT-based liver fat fraction assessment at such a low radiation level.
The main limitation is the size of the dataset. With just 35 subjects, performance estimates still carry considerable uncertainty. A large-scale validation study with a substantially broader cohort is under way, though recruitment is slow because the prospective protocol requires both ultra-low dose CT and MRI. Increasing data diversity, especially with respect to liver disease, is expected to yield more robust models. Beyond that we will investigate alternative denoising and 3D regression backbones, and perform systematic hyper-parameter tuning and ensembling.
By showing that a neural regression network can derive accurate liver fat fraction from ultra-low dose CT, this approach paves the way for safer, more accessible population screening for NAFLD. Integrated into radiology workflows, automated fat fraction reporting could support early diagnosis and enable lifestyle interventions or medical treatment before the disease progresses.
References
- Loomba, R., Friedman, S.L. and Shulman, G.I., 2021. Mechanisms and disease consequences of nonalcoholic fatty liver disease. Cell, 184(10), pp.2537–2564.
- Nassir, F., Rector, R.S., Hammoud, G.M. and Ibdah, J.A., 2015. Pathogenesis and prevention of hepatic steatosis. Gastroenterology & Hepatology, 11(3), p.167.
- Pickhardt, P.J., Graffy, P.M., Reeder, S.B., Hernando, D. and Li, K., 2018. Quantification of liver fat content with unenhanced MDCT: phantom and clinical correlation with MRI proton density fat fraction. American Journal of Roentgenology, 211(3), pp.W151–W157.
- Graffy, P.M., Sandfort, V., Summers, R.M. and Pickhardt, P.J., 2019. Automated liver fat quantification at nonenhanced abdominal CT for population-based steatosis assessment. Radiology, 293(2), pp.334–342.
- Starekova, J., Hernando, D., Pickhardt, P.J. and Reeder, S.B., 2021. Quantification of liver fat content with CT and MRI: state of the art. Radiology, 301(2), pp.250–262.
- Zhang, K., Zuo, W., Chen, Y., Meng, D. and Zhang, L., 2017. Beyond a Gaussian denoiser: residual learning of deep CNN for image denoising. IEEE Transactions on Image Processing, 26(7), pp.3142–3155.
- Hatamizadeh, A., Nath, V., Tang, Y., Yang, D., Roth, H.R. and Xu, D., 2021. Swin UNETR: Swin transformers for semantic segmentation of brain tumors in MRI images. In International MICCAI Brainlesion Workshop, pp.272–284.
- Johnson, J., Alahi, A. and Fei-Fei, L., 2016. Perceptual losses for real-time style transfer and super-resolution. In Computer Vision – ECCV 2016, pp.694–711.
- Green, M., Marom, E.M. and Mayer, A., 2024. Perceptual transformer loss for the neural denoising of ultra-low dose CT. In 2024 IEEE International Symposium on Biomedical Imaging (ISBI), pp.1–5.
- Liu, C.K., Liu, C.C., Yang, C.H. and Huang, H.M., 2021. Generation of brain dual-energy CT from single-energy CT using deep learning. Journal of Digital Imaging, 34(1), pp.149–161.
Content on this page is drawn from the paper “MRI-Supervised Ultra-Low Dose CT for 3D Liver Fat Fraction Mapping” (L. Arbel Issaschar, L. Carl, N. Kiryati, M. Green, E. M. Marom, A. Mayer), presented at the MICCAI 2025 Workshop on Machine Learning in Clinical Decision Support (ML-CDS), and the accompanying project presentation.