Project
Mapping Functional Language Areas with non-Functional MRI
Locating Broca and Wernicke — the brain's language areas — from the anatomical and diffusion scans a patient already receives, with no fMRI, no language task, and no patient cooperation required.
Why language areas must be mapped before surgery
Two small regions of the brain carry most of the machinery of language. Broca, in the frontal lobe, generates words. Wernicke, in the temporal lobe, comprehends them. Damage either one during surgery and the cost is permanent: aphasia, or the loss of the ability to understand speech.
That makes mapping these "eloquent" areas a standard of care before brain surgery — especially for operations in the frontal and temporal lobes, where the surgeon needs to know exactly which tissue can be removed and which must be spared. The map is patient-specific by necessity: language areas do not sit in the same place in every brain, and in patients with lesions or long-standing epilepsy they can be displaced outright.
The trouble with fMRI
The imaging gold standard is functional MRI, which infers neural activity from the blood-oxygen-level-dependent (BOLD) signal while the patient performs a language task in the scanner. It works — but it asks a great deal of both the patient and the department:
- It requires active cooperation. The patient must stay still and perform cognitive tasks on cue — often not possible for paediatric or elderly patients.
- It is time-intensive and expertise-bound. The protocol is long, and the output needs laborious manual post-processing by someone who knows what they are looking at.
- It is fragile. Noise, motion artefacts and tumour-induced signal perturbations all degrade it, and in some clinical settings that fragility is disqualifying.
And there is a particularly cruel failure mode. A lesion sitting next to Broca can impair the patient's ability to perform the very task that is supposed to light Broca up. The closer the disease is to the region you most need to find, the less reliably fMRI finds it.
Because of these limitations, surgeons routinely add a safety margin around fMRI localisations — commonly 5 mm — rather than trusting the boundary exactly. That convention turns out to matter for how this work should be judged, and we return to it below.
Our goal: read function from structure
The scans that are reliably available are the structural ones. Every patient in a neurosurgical work-up gets a T1-weighted scan for anatomy. Most get diffusion tensor imaging, which reveals how white matter fibres are wired — including the arcuate fasciculus, the bundle that physically connects Broca to Wernicke. Neither requires the patient to do anything but lie still.
So the question we set out to answer is whether the language areas can be localised from those two modalities alone. This is a harder problem than it first sounds, because the target is invisible in the input. Broca and Wernicke are functional definitions; nothing in a T1w or diffusion scan directly shows them. The network cannot segment a structure it can see — it has to learn the anatomical and connectivity patterns that predict where function will turn out to be.
To our knowledge no prior work has attempted mapping functional areas without fMRI, and no clinical dataset or benchmark for the task exists.
A real clinical dataset
The cohort is 30 patients with drug-resistant epilepsy, all scanned at our institution's fMRI unit as part of the pre-operative evaluation for potential surgery — the exact population and the exact protocol the method would eventually serve. The study was approved by the institutional review board. Patients whose functional scans were degraded by motion or limited cooperation were excluded, and almost none had clear brain lesions.
Scans were acquired on a SIGNA Premier GE 3T with a 48-channel coil: T1w by MPRAGE at 1 mm isotropic, and DWI at 1 × 1 mm in plane, 2 mm slices, b = 1000 over 64 directions. All language tasks were performed in each patient's native language.
Where the ground truth comes from
The labels are the hard part of this problem, and they are not automatic. Functional scans were motion- and slice-corrected, high-pass filtered, aligned to the T1w scan and realigned to ACPC space. A general linear model then produced a conjunction t-map across three classical language tasks — visual verb generation, auditory verb generation, and sentence generation. For each patient, an individual threshold was tuned by hand to retain only activations inside known language regions, following the same procedure our institution uses to generate real neurosurgical navigation maps, under the supervision of an fMRI expert.
In other words: the ground truth is not an atlas or an approximation. It is the map a surgeon would actually have been given.
Method
Two inputs, two architectures
The network sees a T1w scan for anatomy and a Diffusion Encoded Colour (DEC) map derived from the DTI, which encodes local fibre orientation as colour and carries the white-matter connectivity information. Preprocessing registers DWI to T1w with a 9-parameter similarity transform (FSL), extracts the brain (ANTsPyNet), segments gray matter (FSL) and fits the tensors to build the DEC map (DIPY).
Two architectures were compared. Swin-UNETR concatenates the modalities at the input and runs a Swin transformer encoder into a convolutional decoder, trained multiclass over three channels (background, Broca, Wernicke). AGYnet instead uses a separate encoder per modality and a joint decoder with attention gating, trained one region at a time — in multiclass mode it was unstable and never converged, so separate Broca and Wernicke models were trained.
An anatomically-guided loss
The key methodological ingredient exploits a fact known in advance: functional activation lives in gray matter, by definition. Rather than hope the network discovers this, we write it into the loss. Alongside the usual DiceCE overlap term, an anatomy term penalises probability mass that falls outside the gray matter mask:
where pi is the predicted probability at voxel i and gmi the binary gray matter mask. The term is the fraction of squared prediction mass sitting inside gray matter, subtracted from one — so it goes to zero when the network confines its predictions to anatomically possible tissue.
It helps, most clearly for Broca: Swin-UNETR sensitivity rises from 0.56 to 0.58 and Dice from 0.35 to 0.37; AGYnet Dice from 0.34 to 0.35. Wernicke is more equivocal — Swin-UNETR Dice is unchanged at 0.35 and its sensitivity actually drops from 0.54 to 0.43. The likely reason is that Broca's more intricate anatomical patterning gives an anatomical prior more to work with.
Training in two steps
30 cases is not enough to learn this from scratch, so training starts elsewhere. The network is first pre-trained on 694 HCP cases for a related but purely anatomical task: segmenting Brodmann areas 44–45 and 22, which correlate strongly with the anatomical definitions of Broca and Wernicke and whose labels come free from FreeSurfer. That runs for 100 epochs under a plain Dice loss.
Only then is the model fine-tuned on the 30 clinical cases against the fMRI-derived ground truth, for 70 epochs with a cyclic learning rate averaging 5 × 10⁻⁵. Left–right flip augmentation is applied throughout to counter the over-representation of left-hemisphere language dominance in the general population. Everything runs in PyTorch and MONAI on a single NVIDIA RTX 3090 (24 GB), under 5-fold cross-validation with a 21 / 3 / 6 train / validation / test split so that every case is tested exactly once.
Results
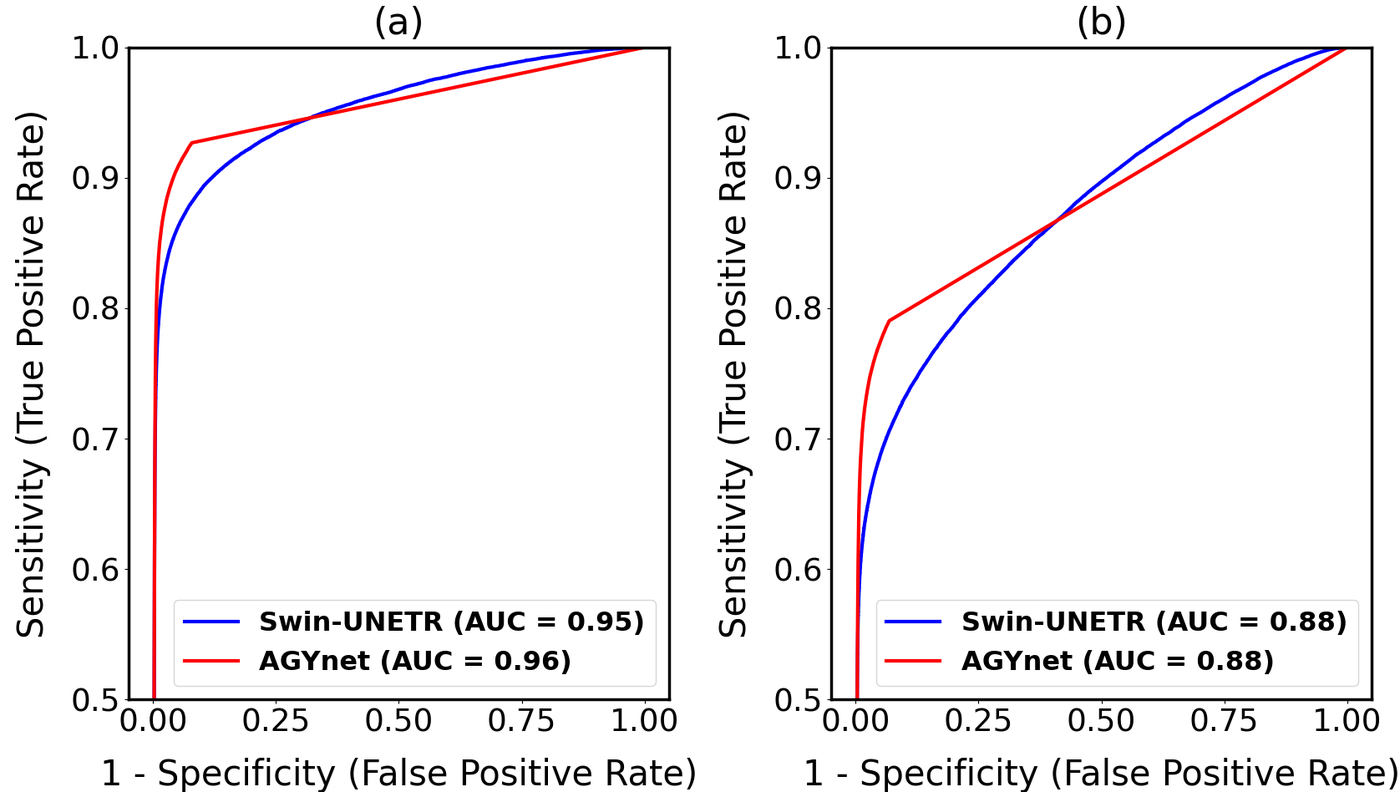
As a classifier the method is strong. The ROC curves reach an AUC of 0.95–0.96 for Broca and 0.88 for Wernicke, with the two architectures essentially tied.
| Model | Broca AUC ↑ | Broca Dice ↑ | Wernicke AUC ↑ | Wernicke Dice ↑ |
|---|---|---|---|---|
| AGYnet | 0.96 | 0.35 ± 0.03 | 0.88 | 0.33 ± 0.04 |
| Swin-UNETR | 0.95 | 0.37 ± 0.04 | 0.88 | 0.35 ± 0.04 |
At the operating point produced by the argmax decision rule, Swin-UNETR gives a sensitivity / specificity of 0.58 / 0.99 for Broca and 0.43 / 0.99 for Wernicke.
The Dice scores are modest, and that needs saying plainly
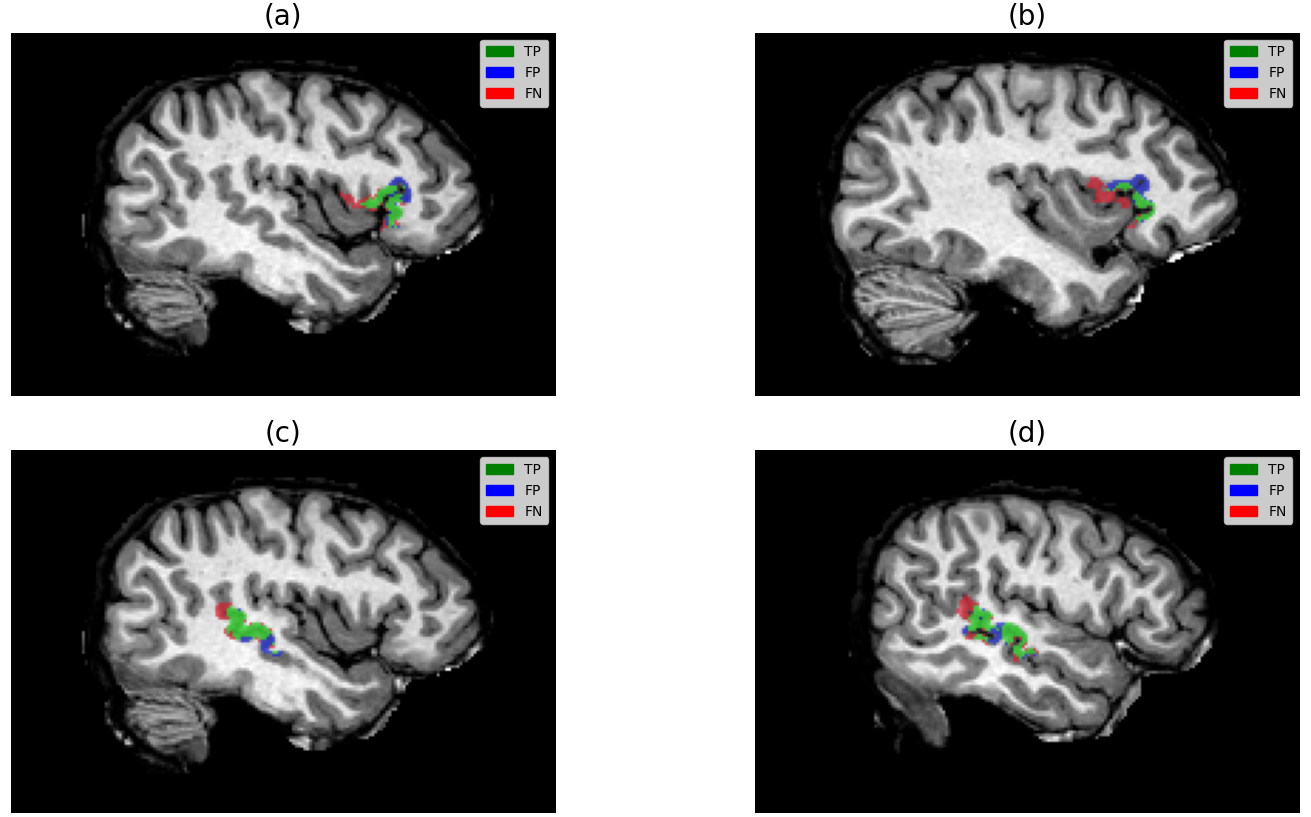
Dice sits around 0.35. For a segmentation paper that number looks poor, and we are not going to dress it up. But two things put it in context. First, these are tiny, irregular targets where a one-voxel boundary disagreement costs a large fraction of the score. Second — and more to the point — every predicted activation lands in a compact, characteristic cluster in the right anatomical neighbourhood, and the misses sit immediately next to the hits rather than scattered elsewhere in the brain (see the qualitative figure at the top of this page). The failure mode is small local displacement, not gross mislocalisation.
Against an atlas-based baseline the gap is stark. Registering the SENSAAS atlas — built from 144 healthy right-handers — to each patient yields a Dice of just 0.09, against 0.29–0.30 for the learned models on the same left-hemisphere-only comparison. A population atlas simply cannot express the individual variability that makes a pre-surgical map worth having.
| Method (left hemisphere only) | Broca Dice ↑ | Wernicke Dice ↑ |
|---|---|---|
| AGYnet | 0.30 ± 0.06 | 0.29 ± 0.04 |
| Swin-UNETR | 0.29 ± 0.07 | 0.29 ± 0.06 |
| SENSAAS atlas | 0.09 ± 0.04 | 0.09 ± 0.06 |
Safety margins: the metric that matters clinically
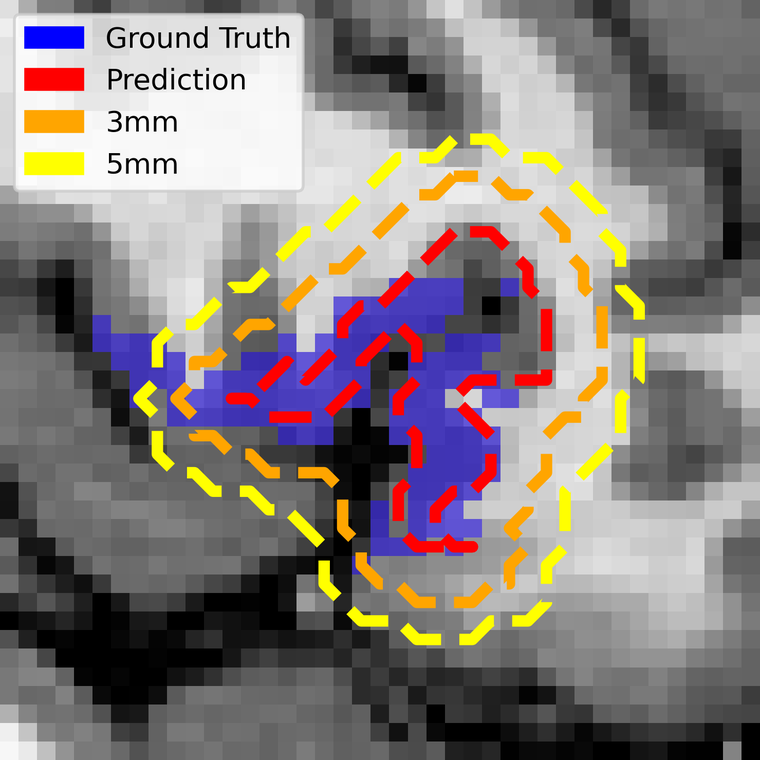
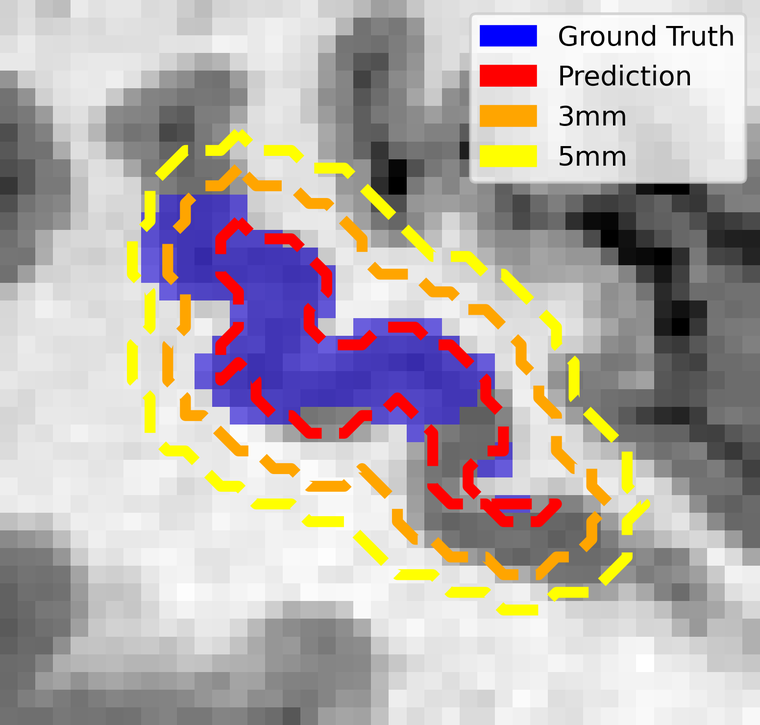
Surgeons do not cut to the boundary of a functional map — they add a margin around it, typically 5 mm, precisely because they do not trust the boundary. So the clinically honest question is not "does the prediction match the ground truth voxel for voxel?" but "once the surgeon's usual margin is applied, is any of the real language area left outside?"
To answer it we computed the distance transform from the predictions and grew them by increasing margins. At 1 mm isotropic resolution, one voxel is one millimetre.
| Safety margin | Broca sensitivity ↑ | Wernicke sensitivity ↑ |
|---|---|---|
| 1 mm | 0.74 | 0.56 |
| 2 mm | 0.80 | 0.63 |
| 3 mm | 0.87 | 0.71 |
| 4 mm | 0.91 | 0.76 |
| 5 mm | 0.95 | 0.80 |
This is the result that reframes the modest Dice. At the 5 mm margin surgeons already apply as a matter of routine, the predictions capture 95% of the true Broca area and 80% of Wernicke — up from 0.58 and 0.43 at zero margin. The information the network is missing is almost all within a few millimetres of where it put it.
Discussion & outlook
Functional language areas can be localised, to clinically meaningful accuracy, from scans that contain no functional information at all. On real pre-surgical cases the method reaches an AUC of 0.96 for Broca and 0.88 for Wernicke, and at the 5 mm margin surgeons already use it recovers 95% and 80% of the true areas — without a task, without patient cooperation, and without an fMRI session.
The limits are worth stating as clearly as the results. Dice remains modest, so this is a planning aid to be reviewed rather than a replacement for an fMRI read where one is obtainable. The cohort is 30 single-centre epilepsy patients, almost all without clear lesions — which leaves the tumour cases, where fMRI is least reliable and this approach would be most valuable, untested. And Wernicke consistently trails Broca, on every metric and under every loss.
What makes the problem interesting is also what makes it hard: the network is being asked to segment something that is not in its input, learning the cross-modality patterns by which structure and connectivity encode function. No prior work has attempted this, and no benchmark exists to measure it against — so the numbers above are less a final score than a first marker laid down for a task that did not previously have one.
Published at MIDL 2025 (Medical Imaging with Deep Learning), Proceedings of Machine Learning Research, vol. 301, pp. 965–977. Implementation details are available in the authors' GitHub repository.
References
- O. Leshem, A. S. Bick, N. Kiryati, N. Levin, and A. Mayer, "Mapping Functional Language Areas with non-Functional Brain MRI," Proceedings of Machine Learning Research, vol. 301, pp. 965–977, MIDL 2025.
- I. Nelkenbaum, G. Tsarfaty, N. Kiryati, E. Konen, and A. Mayer, "Automatic segmentation of white matter tracts using multiple brain MRI sequences," IEEE International Symposium on Biomedical Imaging (ISBI), pp. 368–371, 2020.
- Y. Tang, D. Yang, W. Li, H. R. Roth, B. Landman, D. Xu, V. Nath, and A. Hatamizadeh, "Self-supervised pre-training of Swin transformers for 3D medical image analysis," IEEE/CVF Conference on Computer Vision and Pattern Recognition (CVPR), pp. 20730–20740, 2022.
- D. G. Ellis and M. R. Aizenberg, "Structural brain imaging predicts individual-level task activation maps using deep learning," Frontiers in Neuroimaging, vol. 1, 834883, 2022.
- L. Labache, M. Joliot, J. Saracco, G. Jobard, I. Hesling, L. Zago, E. Mellet, L. Petit, F. Crivello, B. Mazoyer, et al., "A sentence supramodal areas atlas (SENSAAS) based on multiple task-induced activation mapping and graph analysis of intrinsic connectivity in 144 healthy right-handers," Brain Structure and Function, vol. 224, no. 2, pp. 859–882, 2019.
- S. Pajevic and C. Pierpaoli, "Color schemes to represent the orientation of anisotropic tissues from diffusion tensor data: application to white matter fiber tract mapping in the human brain," Magnetic Resonance in Medicine, vol. 42, no. 3, pp. 526–540, 1999.
- D. C. Van Essen, K. Ugurbil, E. Auerbach, D. Barch, T. E. J. Behrens, R. Bucholz, et al., "The human connectome project: a data acquisition perspective," NeuroImage, vol. 62, no. 4, pp. 2222–2231, 2012.
- N. Sanai, Z. Mirzadeh, and M. S. Berger, "Functional outcome after language mapping for glioma resection," New England Journal of Medicine, vol. 358, no. 1, pp. 18–27, 2008.